Energy transitions manifest themselves across space and time. While necessary targets for decarbonisation are apparent, the accompanying shifts in spatial organisation of economic activity are perhaps not as well understood.
The interactive map allows users to visualise the geography of carbon emissions arising from installations under the European Union Emission Trading Scheme (ETS) in 2019. This blog makes use of findings from the map, but the reader is encouraged to experiment for themselves.
Figure 1: Industrial carbon emissions: Interactive map
Source: The map compiles data which industrial installations under the ETS report, found at the European Union Transaction Log. We are grateful to Jan Abrell for the initial cleaning and matching of this data, which he makes freely available at https://euets.info/background and which we use. Data on solar and wind installations are taken from the Global Power Plant Database. Data on active coal mines in the EU are provided by the Joint Research Centre of the European Commission. Data on low carbon steel plants is provided by the Green Steel Tracker developed jointly by Stockholm Environment Institute (SEI) and the LeadIT Secretariat
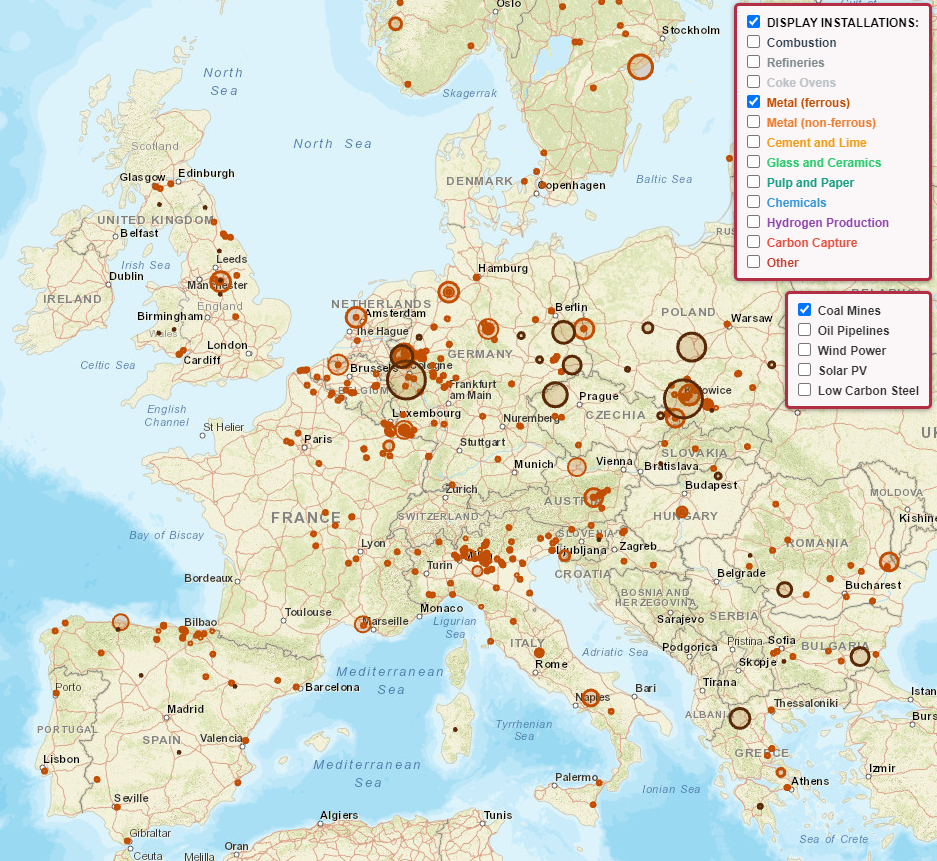
Note: Industrial installations under the ETS are colour coded according to their activity type as shown in the legend. The plants are represented by three different radius circles according to the recorded CO2 emissions in 2019: small (<300,000t) medium (300,001 – 1,000,000t) and large (> 1,000,000t). The sizes of circles for coal mines, solar and wind installations are set according to a continuous scale of the relative capacities, in tonnes of production and MW electricity output, respectively. Oil pipelines are sized independent of capacity.
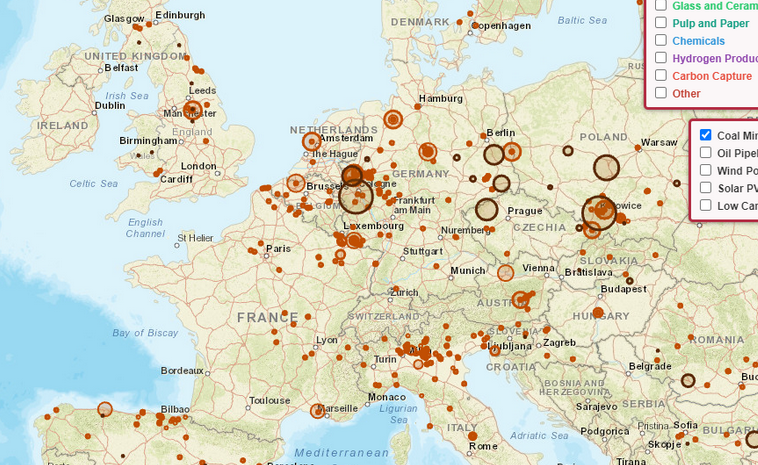
Energy access has been the driving factor for the location of economic activity throughout history. For example, the geographical pattern of industrialisation in 19th century Europe “closely coincided with the geological distribution of coal beneath the ground”. To this day, the map of ferrous metal facilities still closely mirrors that of active coal mines (Figure 2) (notable exceptions are installations close to ports, or those in Northern Italy which likely benefit from abundant hydropower).
Figure 2: Ferrous metals close to coal deposits

The reason is that coal was a relatively costly fuel to transport. It was more efficient to produce steel at sites of coal deposits and then transport the steel.
The emergence of oil in the 20th century as a more readily transferable fuel did allow industrial activity to move away from sources of energy extraction, but still left geographical constraints. A hybrid pipeline-shipping network emerged to transport crude oil toward demand centres. Before consumption, crude oil needs to be transformed into commercially attractive sub-products (petrol, diesel) at a refinery. Therefore, a map of centralised energy refining facilities emerged over Europe, connected to the nodes of this pipeline-shipping network (ie at the end of pipelines or ports). Large industrial consumers of crude oil products, such as chemical facilities, developed directly alongside refineries and remain there today (Figure 3).
Figure 3: Chemicals and hydrogen production close to refineries

Over the coming years, fossil fuels will play a diminishing role in Europe’s energy mix. Access to energy will instead largely be determined by renewable sources of electricity (solar, wind, hydro) and fuels derived from these inputs (hydrogen, ammonia). Sources of energy capture, conversion and distribution will change, and this will push forward a new topography of economic activity, no longer constrained by carbon deposits. The societal importance of this is highlighted by the United Kingdom’s exemplar experience of industrial restructuring in the second half of the 20th century. Rapid de-industrialisation had a “distinct … geographical pattern”, and “restructured the social fabric of Britain in significant and selective directions”, which persist to this day.
The extent to which a significant industrial relocation occurs will depend upon a mix of:
- location-specific differences in the costs of capturing (clean) energy;
- the ability to cheaply transport this energy;
- existing ‘sticky’ effects whereby layers of economic activity agglomerate around initial capital and human investments.
The relative costs of capturing energy are primarily determined by revalued geological resources (eg the availability of solar and wind energy, see interactive map for current deployment trends). Alongside natural geography, the cost of capital is a second key determinant of deployment. The share of capital costs in renewable production is higher than for fossil fuel extraction, where operating costs play a significant role, and hence cost of capital can be expected to play an increasing role in shaping the geography of energy capture and conversion. This will be particularly important when considering competition between deployment inside or outside the EU’s borders.
Whether heavy-industry subsequently relocates toward cheaper sources of energy capture will depend on the cost of transporting energy. Concretely, the comparison of cost differences by location and transportation costs will drive the economic case for or against relocation.
Without significant infrastructure investments, as electricity demand grows, there will be increasing grid congestion and bottlenecks. Already, areas of the power grid struggle to move renewable generation to sources of demand – a prime example is Germany that has built up significant wind and solar generation capacity in its north but fails to connect this to demand centres in the south. In a perfect market, price discrepancies would develop and encourage relocation. However, choices of market design can soften price differences across locations (eg, there is a unique electricity wholesale price enforced in Germany, while Italy is split in six pricing zones). The implication is that Germany suppresses natural price movements and socialises inefficient industry location.
Beyond electricity, it is plausible that clean gases, such as hydrogen or biomethane, will be transported. These gases require facilities for initial transformation from electricity. They may emerge in a centralised structure (like today’s oil refineries) or be more decentralised. This will depend on the economies of scale associated with transformation and the build out of infrastructure to transport green gases from central production points to more distributed demand centres. In any case, industry estimates that hydrogen transport can be relatively cheap (of the same orders of magnitude as transporting natural gas).
An important question will be whether it is cheaper to transport intermediate input products (electricity, hydrogen) or final products. For example, will it be cheaper to transport one tonne of steel from Morocco to Spain or to transport the hydrogen required for producing one tonne. Assuming 2.5 MWh hydrogen / tonne steel, estimates would place the cost of transporting the hydrogen at (2.5 MWh/t * €6 /MWh) €15 /t. An industry estimate suggests that transporting a tonne of steel by ship has a similar transport cost.
However, tomorrow’s locational choices are not carved onto a blank map. Industrial locations are well-established and there are benefits from co-location through agglomeration effects. Massey (1984) highlights the concept of economic ‘layering’ whereby new industries establish themselves close to existing locations due to positive externalities. For industries to retain their existing location, substantial new supplies of energy will need to be established. In a post fossil fuel economy, this will depend on the low-cost build-out of new energy infrastructure for transporting electricity and alternative low carbon fuels.
So far, pilot low carbon steel projects have preferred to locate within industrial clusters (Figure 4). It remains to be seen whether this will be the case as economies scale. There might be tipping points where enough facilities move from where input factors were directly available in the past to where they are best available now, that a critical mass arrives in new locations, sparking new agglomeration benefits. For example, demonstration hydrogen-steel plants have been deployed in Hamburg close to wind farms on the northern German coast.
Figure 4: Low carbon steel plants planned next to existing capacity

For policymakers, a key question will be whether to preserve existing structures by implementing measures to keep energy access/prices at incumbent locations competitive, or to embrace a new economic geography of decarbonised energy. Policies to defend the current geography could be outright price regulations and subsidies (such as the indirect cost compensation that only some EU countries offer to their industrial consumers), market design choices (eg on regional price differentiation) or energy infrastructure investments. In Germany, for example, consumers in the wind-power rich north do not benefit from lower generation cost (as wholesale prices are kept uniform across Germany) but have to contribute to the transmission lines towards the incumbent demand centres in the south.
These will not only be national energy policy choices –the degree to which a new economic geography can unfold will also be substantially shaped by European Union legislation on infrastructure planning, state aid, energy market design and climate policies. The political economy of this change will be exciting: incumbent industrial powerhouses will have a lot of resources to defend existing structures while emerging renewables champions might potentially see a fresh chance for an industrialisation.
Recommended citation:
McWilliams, B. and G. Zachmann (2021) ‘A new economic geography of decarbonisation?’, Bruegel Blog, 8 November

