By Lionel Guetta-Jeanrenaud Ben McWilliams Georg Zachmann
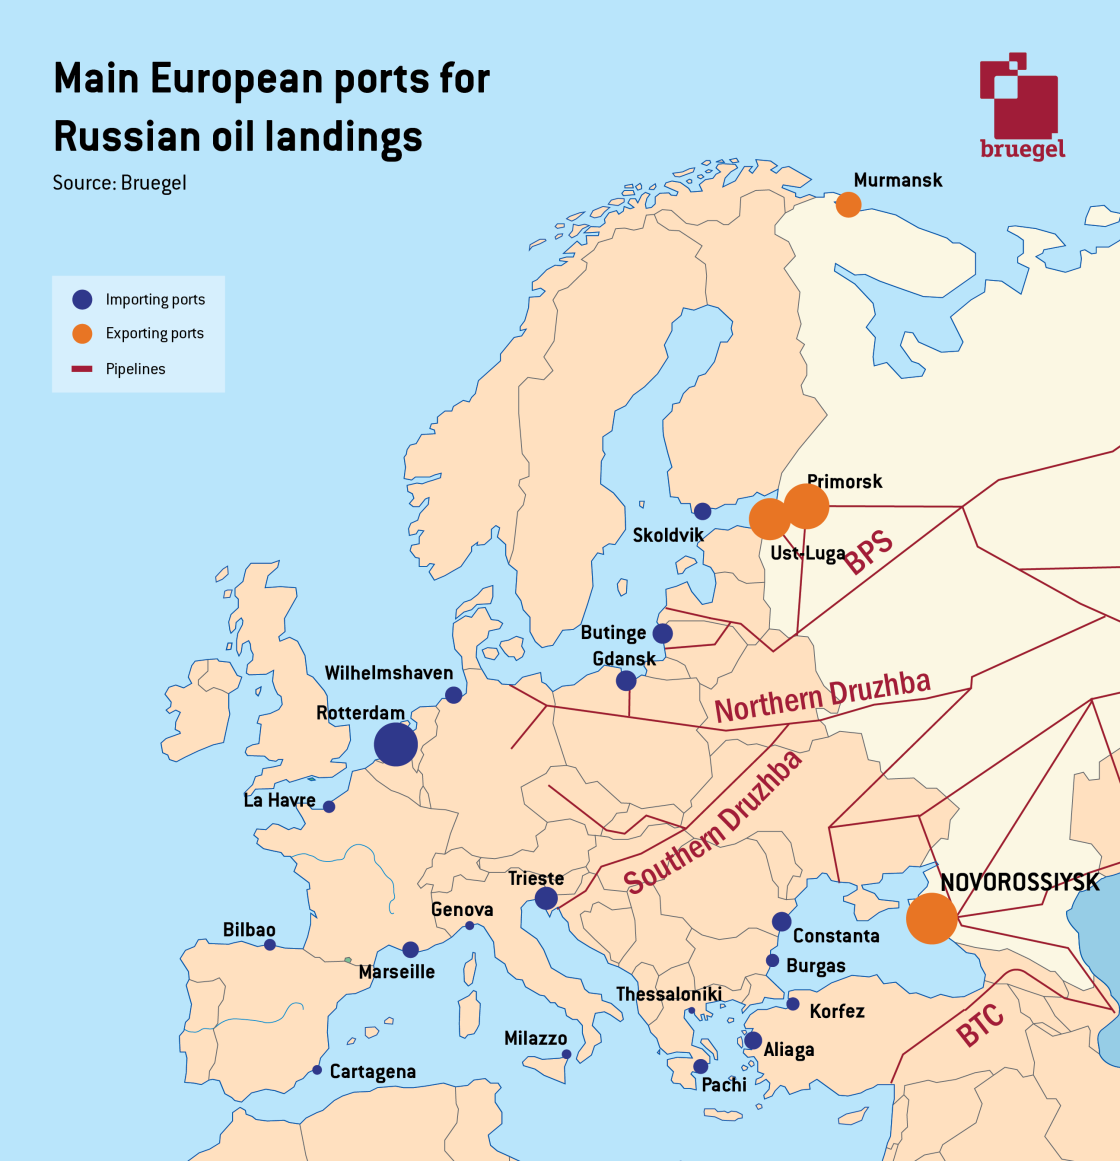
This dataset aggregates weekly and monthly data on Russian exports of crude oil since the beginning of 2021 (we do not include oil products). We track oil leaving the four main Western Russian ports (Primorsk, Ust-Luga, Murmansk and Novorossiysk) using real-time vessel data to infer the amount and destination of exports.
We will update the numbers once every week. While we primarily extract data from Bloomberg, we benefit greatly from the work performed by CREA.
Figure 1 shows weekly exports of Russian crude oil for 2021 and 2022. All oil leaving Russian ports is included, no matter the destination. Numbers are aggregated according to the departure date of the tankers.
To better understand who is buying Russian oil, we track ships leaving ports and determine where they are unloading their crude oil. Figure 2 shows weekly amounts of oil being unloaded in the European Union (main ports are Rotterdam, Le Havre, Wilhelmshaven, Trieste and Gdansk) or in countries that are neither in the EU nor the G7 (mainly India and China). Numbers are aggregated according to the date of arrival of the tankers.
Finally, we also aggregate monthly numbers to better show which countries are the main importers of Russian oil. EU countries are in various shades of blue (decomposed by region). Ship-to-ship transfers are included in the “other” category.
Figure 3: Monthly Landings of Russian Crude Oil by Region

METHODOLOGY
General approach
We constructed this database of crude oil (oil products are not included) using real-time data of crude oil tankers. The ship data is from Genscape and is available using the following aggregators: Bloomberg, CREA and MarineTraffic. We accessed individual ship data using Bloomberg and cross-checked this with CREA data.
We restricted our analysis to ships that were in the vicinity (within 30 km) of one of the four main Russian ports (Primorsk and Ust-Luga in the Baltic Sea, Novorossiysk in the Black Sea and Murmansk in the Arctic Sea) at any given time since January 2021. It is important to note that oil transiting through Russian ports is not exclusively Russian. Some crude oil is exported from Kazakhstan to both Novorossiysk and Ust-Luga through Russia’s Transneft pipeline system. Our numbers therefore include some Kazakh oil that was loaded onto ships in Russian ports. We describe our method for excluding this oil below.
When a ship enters a Russian port, we tracked it based on the data it reported several times a day. This included date, current location (latitude and longitude), listed destination, ship ID and, crucially, current draft (how full the ship is).
We combined location and draft data to determine the flows of Russian oil. We defined a ship as being loaded if its draft increased by more than 15% when in the vicinity of a Russian port. If this happened, it marked the beginning of a trip.
A trip was completed if we observed a significant decrease in the draft (by more than 15%) in our data. when this happened, we matched the location where the decrease occurred with a frequently updated list of geolocated ports to determine in what region the oil was unloaded (a ship lands in a given port if its draft decreases significantly within 30 km of the port’s location).
We did not use the destination listed by the ships for two main reasons. The first is that a ship might unload its oil somewhere else on the way. The second is that many tankers make ship-to-ship transfers, usually at sea, in areas suitable for anchoring. Here, the listed destination (Skagen in Denmark or Port Said in Egypt are frequently listed destinations in such cases) does not truly reflect where the oil ends up. As we couldn’t track ships that were loaded through ship-to-ship transfers, we listed their destination as “Undetermined”.
If we did not observe the unloading of a ship in our dataset, we considered the trip to still be in progress. We nevertheless stored its listed destination, its current draft and coordinates. If a tracked ship significantly increased its load elsewhere (not in a Russian port), we dropped the observation.
In order to estimate the volumes of oil being shipped, we estimated oil tankers to be carrying a total load of 85% their maximum capacity. In other words, a tanker with maximum load of 100,000 tons is considered to be transporting 85,000 tons. A ship is either listed as full or empty, meaning that we did not include ships that were half full.
Excluding Kazakh oil that transits through the Black Sea port of Novorossiysk
An important share of the oil that is loaded in the port of Novorossiysk is not Russian but Kazakh, transported to the Black Sea through the Transneft pipeline system and loaded onto tankers from the dedicated Caspian Pipeline Consortium (CPC) Terminal. While also in the area of the city of Novorossiysk, the CPC terminal is outside the bay where the main port is located. We therefore use the coordinates of ships while they are being loaded to determine whether or not they are transporting Russian oil. Indeed, if a ship does not enter the bay when loading in the vicinity of Novorossiysk, we consider it to be transporting Kazakh oil and drop it from our dataset. In line with evidence gathered elsewhere (OPEC, Bloomberg Tanker Tracker), we find that loadings of Kazakh oil historically represent around two thirds of total loadings in Novorossiysk.
DATA POLICY
This page provides a number of Bruegel datasets for public use. Users can freely use our data in its unchanged form or after any transformation for any purpose and can freely distribute it, provided that proper attribution is made to the source, but not in any way that suggests that Bruegel endorses the user or their use of the data. We will continually explore possibilities to improve data-quality.

